Reading the Yield Curve: A 5-Minute Primer
Why the gap between the 2-year and 10-year Treasury is one of the most-watched numbers in markets — and what an inversion really signals.
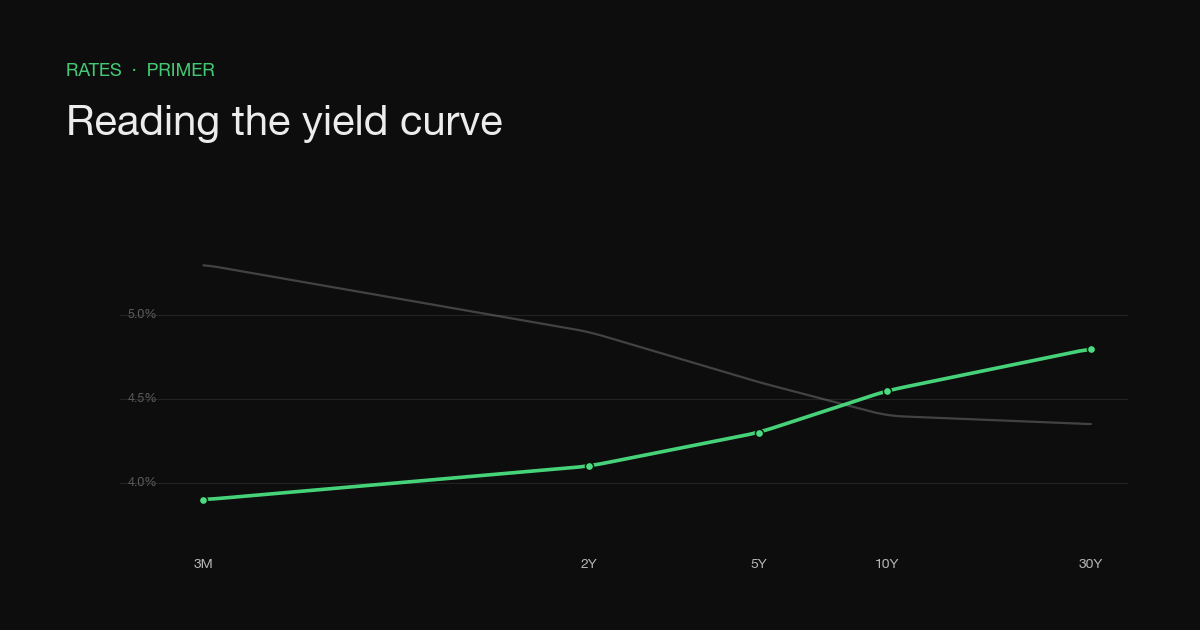
The “yield curve” sounds technical, but the idea is simple: it is a chart of interest rates on government bonds across different maturities, from a few months to thirty years. Its shape tells you what the bond market expects.
Normal, flat, inverted
| Shape | Long rates vs short rates | What it tends to signal |
|---|---|---|
| Normal (upward) | Long > short | Healthy growth expectations |
| Flat | Long ≈ short | Uncertainty / transition |
| Inverted | Long < short | Tighter policy now, slowdown later |
In normal times you are paid more to lend for longer — that is the upward slope. When the curve inverts, short-term rates sit above long-term rates, which is the bond market’s way of saying it expects rate cuts down the road, usually because growth is slowing.
The 2s10s spread
The single most-quoted version is the 2s10s spread — the 10-year yield minus the 2-year yield.
An inverted 2s10s spread has preceded every U.S. recession in the last half-century. It is early, not precise: the lag from inversion to downturn has ranged from several months to roughly two years.

Why it works (and why it lags)
Short rates are anchored to the central bank’s policy rate. Long rates reflect the average expected short rate over the bond’s life plus a term premium. When investors expect the central bank to cut in the future — typically to rescue a slowing economy — long rates fall below short rates. The signal is powerful but early, which is why “inversion” and “recession” can be a year or more apart.
How to use it
- Track the 2s10s spread as a slow-moving regime gauge, not a timing tool.
- Watch the re-steepening after an inversion — historically that is the part that has coincided with downturns.
- Pair it with credit spreads and employment data; no single indicator is destiny.
The yield curve will not tell you what happens next week. It is a barometer of expectations — and a reminder that the bond market is often pricing the cycle before the stock market does.
Sources
- U.S. Treasury daily par yield curve rates.
- Federal Reserve research on the term spread and recessions.