The Fed Held Rates — What the Dot Plot Actually Says
The decision is the headline. The projections are the story. A plain-English guide to reading the FOMC dot plot.
Every six weeks the Federal Open Market Committee announces a rate decision, and every quarter it publishes a Summary of Economic Projections (SEP) — including the famous “dot plot.” The decision is the headline. The dots are the story.
What the dot plot is
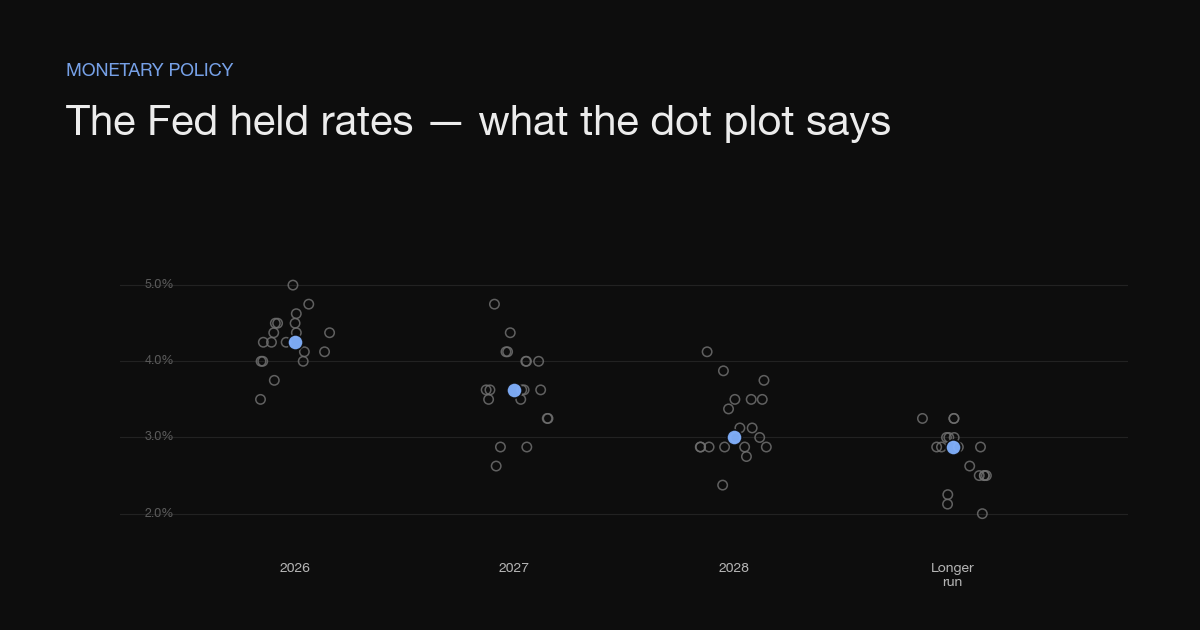
Each dot is one FOMC participant’s view of where the policy rate should be at the end of each year. It is anonymous, it is not a promise, and it changes meeting to meeting. What matters is the median dot and how it shifts versus the prior projection.
| Signal | What it means | Typical market reaction |
|---|---|---|
| Median dot moves up | More hikes / higher-for-longer | Yields up, growth stocks down |
| Median dot moves down | Cuts coming sooner | Yields down, risk assets up |
| Dots unchanged, tone dovish | Patience, data-dependent | Depends on the press conference |
Why “hold” can still move markets
A pause is rarely just a pause. The market re-prices on three things released the same afternoon:
- The dots — did the median path for next year move?
- The statement language — did “additional firming” become “additional policy firming may be appropriate”?
- The press conference — the Chair’s tone often matters more than the statement.
Don’t trade the decision. Trade the change in the path — the difference between this projection and the last one.

A simple checklist for FOMC day
- Find the median year-end dot and compare it to last quarter’s.
- Note the dispersion — tightly clustered dots signal consensus; scattered dots signal uncertainty.
- Read the first paragraph of the statement (the economic assessment) for tone.
- Watch the 2-year Treasury yield — it tracks rate expectations most directly.
The dot plot is a forecast, not a commitment. Treat it as the committee’s current best guess, and weight the direction of change over the absolute level.
Sources
- FOMC statement and implementation note.
- Summary of Economic Projections (the dot plot).
- Chair’s post-meeting press conference.